For informations about installation of the image analysis tool, access the “Simulator” tab
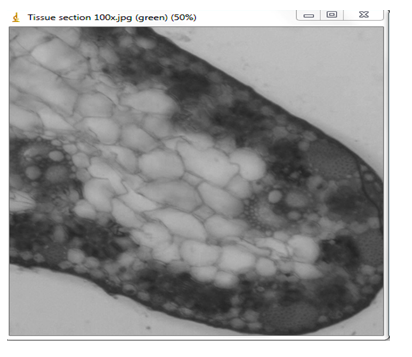
Step 1: Import the image of Lignin stained tissue section into image analysis software.
Step 1: Import the image of Lignin stained tissue section into image analysis software.
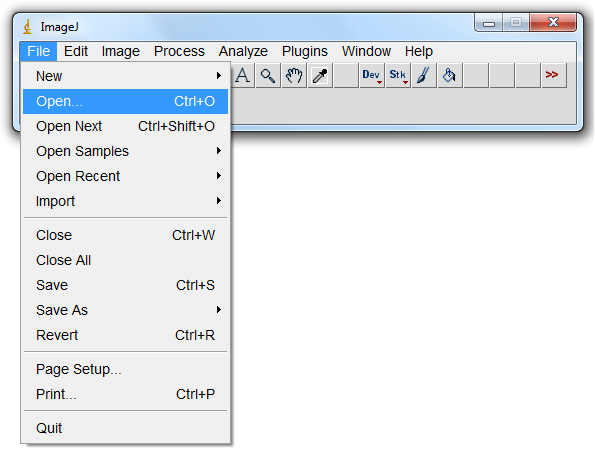
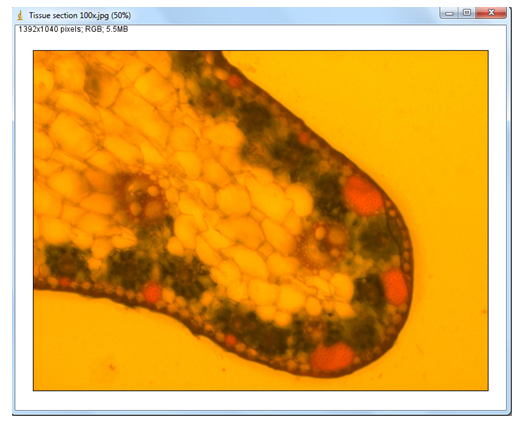
The image will open in a new pop up window as shown.
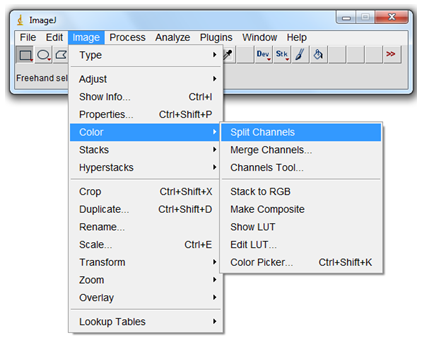
Step 2: To split the section into different channels follow, image ---> color ---> split channels.
A new pop window will open, which will show the tissue section in three channels: green, blue and red.
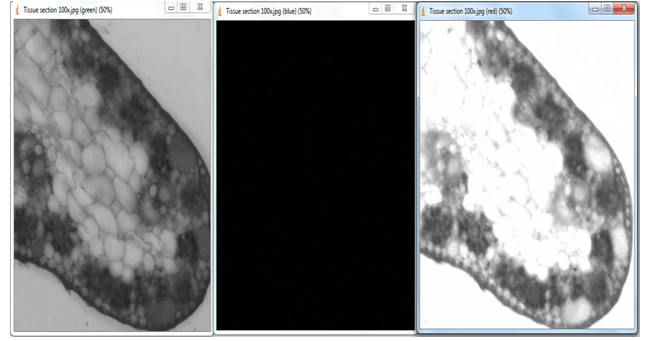
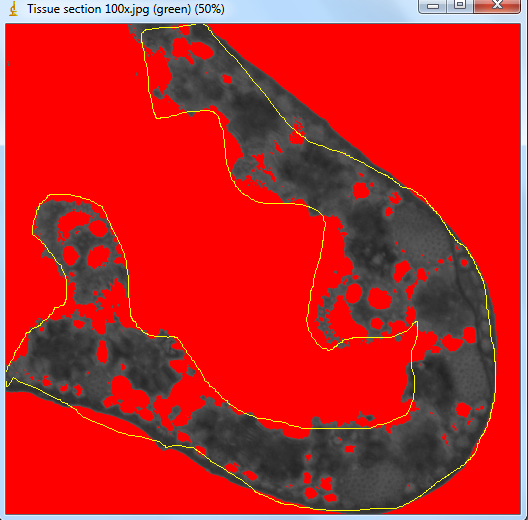
Step 3: Select any one of the image that will be easier to analyze (Select a clear image). Here tissue section in green is selected for further analysis.
Step 4: Then adjust threshold to find the intensity of lignin staining. Follow, Image ---> Adjust ---> Threshold
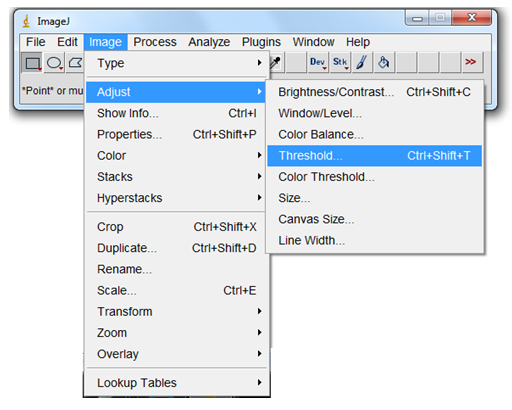
While adjusting the threshold, select the lignin stained region of the imported image.
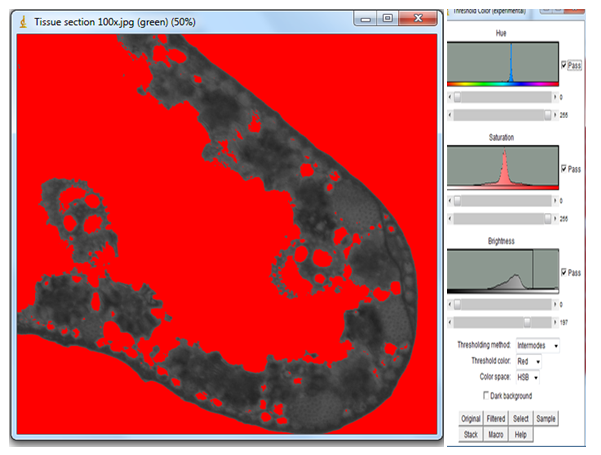
Step 5: Using the free hand selection tool, select the stained region of the imported image.
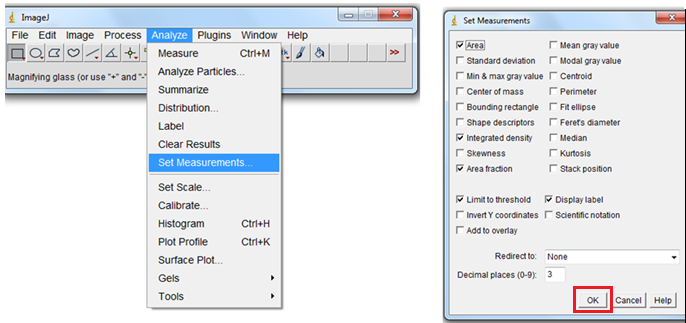
Step 6: Set measurements to find the intensity of lignin stained region. Follow Analyze ---> Set Measurements. Select the options Area, Integrated density, Area Fraction, Limited to threshold and Display Label in the Menu. Then click OK to analyze the image.
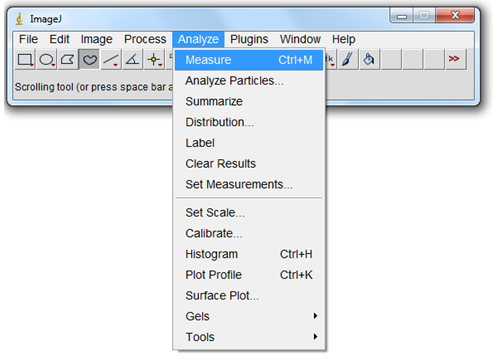
Step 7: To quantify the lignin stained area in the imported image, follow Analyze ---> Measure
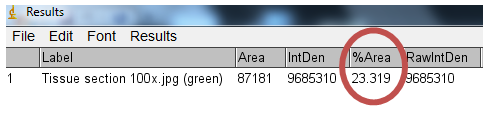
A new pop up window will show the results of the tissue section.
Result Interpretation:
Percentage Area indicates the amount of lignin in the selected stained region. Here, 23 percent of the total selected region (Total Area 87181) is lignin.
Percentage Area indicates the amount of lignin in the selected stained region. Here, 23 percent of the total selected region (Total Area 87181) is lignin.
